What Is GDP? A Clear, Beginner-Friendly Guide
Affiliate disclosure: This article may contain affiliate links. Recommendations are independent and editorially driven.
Key Takeaways
- **What is GDP?** Gross Domestic Product (GDP) is the total monetary value of all final goods and services produced within a country’s borders in a specific period, typically a year or a quarter. It’s the primary measure of a nation’s economic output and health.
- **Components of GDP:** GDP is usually calculated by adding up consumption, investment, government spending, and net exports (exports minus imports).
- **Nominal vs. Real GDP:** Nominal GDP reflects current market prices and can be inflated by rising prices. Real GDP adjusts for inflation, providing a more accurate picture of actual economic growth by measuring output in constant prices.
- **Why it Matters:** GDP growth indicates economic expansion, potentially leading to job creation, higher wages, and improved living standards. It influences government policy, interest rates, and investment decisions.
- **Limitations:** While vital, GDP doesn’t measure income inequality, environmental impact, or non-market activities, and therefore isn’t a complete gauge of societal well-being.
Table of Contents

- 1. What is GDP? Defining the Core Concept of Economic Output
- 2. The Four Components of GDP: Unpacking Expenditure and Its Drivers
- 3. How is GDP Calculated? Approaches and Methodologies Explained
- 4. Nominal vs. Real GDP: Understanding Inflation’s Impact on Economic Growth
- 5. Limitations of GDP as an Economic Indicator: What It Doesn’t Measure
- 6. How GDP Affects Your Personal Finances, Jobs, and Investments
- 7. Global GDP Comparisons and Their Significance in the World Economy
- 8. Alternative Economic Indicators Beyond GDP: A Broader Perspective
- 9. The Future of GDP Measurement and Modern Economic Analysis
- Frequently Asked Questions
1. What is GDP? Defining the Core Concept of Economic Output
In the realm of personal finance and economic news, few terms are as frequently cited or as fundamentally important as Gross Domestic Product (GDP). So, what is GDP, and why should it matter to you? At its core, GDP represents the total monetary value of all final goods and services produced within a country’s geographical borders over a specified period, typically a quarter or a year. It is the most widely recognized measure of a nation’s economic output and, by extension, its economic health.
Think of GDP as a comprehensive scorecard for a country’s economic activity. Every time a car is manufactured, a new house is built, a haircut is given, or software is developed, these activities contribute to a nation’s GDP. It encompasses everything from the smallest retail transaction to massive infrastructure projects. The “final” aspect is crucial: GDP only counts the value of goods and services sold to the end-user, avoiding double-counting intermediate goods (e.g., the steel used to make a car is not counted separately from the car itself).
The Purpose and Importance of GDP
For economists, policymakers, and investors alike, GDP provides a vital snapshot of economic performance. A rising GDP generally signals a healthy, growing economy, often accompanied by job creation, increased income, and improved standards of living. Conversely, a declining GDP can indicate economic contraction, potentially leading to job losses, reduced consumer spending, and recessionary pressures. Governments use GDP data to formulate fiscal and monetary policies, central banks adjust interest rates based on GDP trends, and businesses make investment and expansion decisions.
Understanding what GDP signifies is not merely an academic exercise; it has tangible impacts on your daily life. It influences the job market, the stability of your investments, and even the cost of borrowing money. While not a perfect measure of societal well-being, GDP remains an indispensable tool for gauging economic activity and forecasting future trends. It serves as a common language for comparing economic performance across different countries and over various time periods, offering insights into competitiveness and global economic shifts. Learning to interpret GDP reports is a fundamental step in becoming a more informed consumer and investor in today’s interconnected financial world.
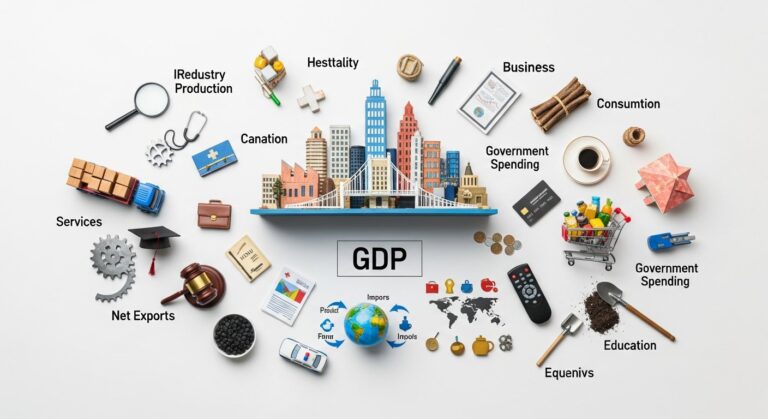
[INLINE IMAGE 1: place after second H2 | alt=”what is gdp concept illustration”]
2. The Four Components of GDP: Unpacking Expenditure and Its Drivers
To fully grasp what is GDP, it’s essential to understand its constituent parts. The most common way to calculate and conceptualize GDP is through the expenditure approach, which aggregates all spending on final goods and services in an economy. This approach breaks GDP down into four primary components, often represented by the formula: GDP = C + I + G + NX.
Consumption (C) – The Engine of the Economy
Consumption represents the largest component of GDP in most developed economies, typically accounting for 60-70% of total economic activity. This category includes all spending by households on goods and services. It covers a vast range of purchases:
- **Durable Goods:** Items that last a long time, such as cars, appliances, and furniture.
- **Non-Durable Goods:** Items that are consumed quickly, like food, clothing, and gasoline.
- **Services:** Intangible activities provided by others, including healthcare, education, legal services, entertainment, and housing (rent).
Consumer confidence and disposable income are key drivers of consumption. When consumers feel secure about their jobs and financial future, they tend to spend more, boosting GDP. Economic downturns often see a significant drop in consumption, as households tighten their belts.
Investment (I) – Fueling Future Growth
Investment, in the context of GDP, refers to spending by businesses on capital equipment, structures, and inventories, as well as household spending on new housing. It’s crucial for long-term economic growth and productivity. This component includes:
- **Business Fixed Investment:** Purchases of new machinery, equipment, factories, and office buildings.
- **Residential Investment:** Spending on new homes and apartments by households and landlords.
- **Inventory Investment:** Changes in the stock of goods that businesses have produced but not yet sold. An increase in inventories adds to GDP, while a decrease subtracts from it.
Investment is highly sensitive to interest rates and business expectations. Lower interest rates can make borrowing cheaper for businesses, encouraging investment. Positive economic outlooks also spur companies to expand their capacity and innovate, driving this component.
Government Spending (G) – Public Sector Contributions
Government spending includes all expenditures by local, state, and federal governments on final goods and services. This covers a wide array of public sector activities:
- **Public Goods and Services:** Salaries of government employees (teachers, police, military), construction of roads, bridges, and public buildings, defense spending, and public health initiatives.
It’s important to distinguish government spending on goods and services from transfer payments (like Social Security benefits or unemployment insurance). Transfer payments are not included in GDP because they do not represent the production of new goods or services; rather, they are a redistribution of existing income. Government spending can be a significant stabilizer during economic downturns, as governments can increase spending to stimulate demand.
Net Exports (NX) – Connecting to the Global Economy
Net exports represent the difference between a country’s total exports and its total imports (NX = Exports – Imports). This component captures the impact of international trade on a nation’s GDP:
- **Exports:** Goods and services produced domestically and sold to foreign countries. Exports add to a country’s GDP because they represent domestic production.
- **Imports:** Goods and services produced in foreign countries and purchased by domestic consumers, businesses, or governments. Imports are subtracted from GDP because they represent spending on foreign production, not domestic.
If a country exports more than it imports, it has a trade surplus, and net exports add positively to GDP. If it imports more than it exports, it has a trade deficit, and net exports subtract from GDP. Exchange rates, global economic conditions, and trade policies significantly influence a country’s net exports. For instance, a strong domestic currency can make imports cheaper and exports more expensive, potentially widening a trade deficit.
Understanding these four pillars of expenditure provides a comprehensive view of how economic activity is measured and where growth (or contraction) is originating within an economy. Each component plays a unique and dynamic role in shaping the overall GDP figure and, consequently, the economic narrative of a nation.
3. How is GDP Calculated? Approaches and Methodologies Explained
While the expenditure approach (C + I + G + NX) is the most commonly cited method for understanding what is GDP, economists and national statistical agencies employ three primary approaches to calculate this vital metric. In theory, all three methods should yield the same result, as they are simply different ways of measuring the same economic activity. In practice, slight discrepancies can occur due to data collection and statistical adjustments. The three main methods are the Expenditure Approach, the Income Approach, and the Production (or Output/Value-Added) Approach.
The Expenditure Approach: Summing Up Spending
As detailed above, this method calculates GDP by summing up all spending on final goods and services by households, businesses, governments, and net foreign buyers. It reflects the demand side of the economy.
Formula: GDP = Consumption (C) + Investment (I) + Government Spending (G) + Net Exports (NX)
- C (Consumption): Personal consumption expenditures on durable goods, non-durable goods, and services.
- I (Investment): Gross private domestic investment, including fixed investment (business equipment, structures, residential housing) and changes in business inventories.
- G (Government Spending): Government consumption expenditures and gross investment.
- NX (Net Exports): Exports minus imports of goods and services.
This approach is often favored for its intuitive nature, as it directly reflects how much money is being spent on newly produced output within the economy. Data for this method is collected from surveys of consumers, businesses, and government agencies.
The Income Approach: Aggregating Earnings
The income approach calculates GDP by summing all the incomes earned by the factors of production in the economy, including wages, profits, rent, and interest. This method reflects the supply side, recognizing that every expenditure made by one party is an income received by another.
Formula: GDP = Wages + Rent + Interest + Profits + Indirect Business Taxes + Depreciation (Consumption of Fixed Capital)
- Wages/Compensation of Employees: This includes salaries, benefits, and employer contributions to social insurance and pension funds.
- Rent: Income earned from property, including imputed rent for owner-occupied housing.
- Interest: Net interest earned by individuals from lending capital.
- Profits: Corporate profits (dividends, undistributed profits, corporate income taxes) and proprietor’s income (income of self-employed individuals).
- Indirect Business Taxes: Sales taxes, excise taxes, property taxes, and customs duties that are passed on to consumers. These are added because they are part of the market price of goods and services but do not directly accrue to factors of production.
- Depreciation (Consumption of Fixed Capital): This accounts for the wear and tear on capital goods (machinery, buildings) used in production. It’s added back to get Gross Domestic Product because the other components measure net income.
The income approach provides a different lens through which to view economic activity, focusing on how the value created is distributed among those who contributed to its production. This method is particularly useful for analyzing income distribution and factor shares in the economy.
The Production (or Output/Value-Added) Approach: Tracking Industry Contributions
This method calculates GDP by summing the “value added” at each stage of production across all industries within an economy. Value added is the market value of a firm’s output minus the value of the intermediate goods it purchased from other firms. This avoids the problem of double-counting. For example, if a baker buys flour to make bread, only the value of the bread is counted in GDP, not the flour separately.
Formula: GDP = Sum of Value Added by All Industries
- **Sectoral Contribution:** This involves identifying all productive sectors of the economy (agriculture, manufacturing, services, construction, etc.).
- **Value Added Calculation:** For each sector, the value of its output is calculated, and then the cost of intermediate inputs (raw materials, semi-finished goods) used in that production is subtracted.
This approach offers a detailed breakdown of where economic production is occurring, allowing analysts to see which sectors are growing or contracting. It is especially useful for understanding the structural changes within an economy and the relative importance of different industries. National statistical agencies often combine elements from all three approaches to ensure accuracy and consistency in their GDP estimates, performing revisions as more comprehensive data becomes available.
Learn more about how economic indicators are collected and analyzed.
4. Nominal vs. Real GDP: Understanding Inflation’s Impact on Economic Growth
When discussing what is GDP, it’s crucial to differentiate between nominal GDP and real GDP. This distinction is fundamental because it accounts for the distorting effects of inflation, providing a more accurate picture of whether an economy is truly growing in terms of output, or merely appearing to grow due to rising prices.
Nominal GDP: Current Prices, Current Production
Nominal GDP measures the total value of all final goods and services produced within a country’s borders using current market prices. This means that if prices rise (inflation), nominal GDP can increase even if the actual quantity of goods and services produced remains the same or even decreases. Conversely, if prices fall (deflation), nominal GDP can decrease even if real output has grown.
- Calculation: Values output at the prices prevailing in the year of production.
- Usefulness: Good for comparing the absolute size of economies at a given point in time; reflects the raw monetary value of production.
- Limitation: Does not account for changes in the purchasing power of money; an increase could be entirely due to inflation, not increased production.
For example, if a country produces 100 widgets at $10 each in one year (Nominal GDP = $1000), and then produces 100 widgets at $12 each the next year (Nominal GDP = $1200), the nominal GDP has increased by 20%, but the actual output of widgets hasn’t changed. This makes nominal GDP less reliable for assessing genuine economic growth over time.
Real GDP: Constant Prices, True Growth
Real GDP measures the total value of all final goods and services produced within a country’s borders, but it adjusts for price changes (inflation or deflation). It values output at constant prices from a selected base year. By doing so, real GDP isolates changes in the quantity of goods and services produced, providing a clearer indication of actual economic growth.
- Calculation: Values output at the prices of a chosen base year. This adjustment typically uses a price deflator (like the GDP deflator).
- Usefulness: The most important measure for assessing economic growth, as it reflects changes in the actual volume of production. Essential for comparing economic performance across different time periods.
- Limitation: The choice of base year can influence the magnitude of real GDP and growth rates, though the trend remains consistent.
Using the widget example: If the base year price for a widget is $10, then in the second year, even though the widgets sell for $12, they would still be valued at $10 for real GDP calculation. So, 100 widgets at $10 base year price = $1000 Real GDP. In this case, real GDP shows zero growth, accurately reflecting that the quantity produced did not change, despite the nominal increase.
The GDP Deflator: Bridging the Gap
The GDP deflator is a measure of the overall level of prices in an economy. It’s used to convert nominal GDP into real GDP, and vice-versa. It reflects the prices of all newly produced goods and services within the domestic economy.
Formula: GDP Deflator = (Nominal GDP / Real GDP) x 100
A rising GDP deflator indicates inflation, while a falling deflator suggests deflation. By using the deflator, economists can strip away the effects of price changes, providing a more accurate assessment of an economy’s productive capacity over time. For investors, understanding real GDP is paramount because it reflects the true health of the economy, which in turn impacts corporate earnings, employment, and investment returns.
[INLINE IMAGE 2: place after fourth H2 | alt=”what is gdp comparison illustration”]
5. Limitations of GDP as an Economic Indicator: What It Doesn’t Measure
While GDP is undoubtedly the most comprehensive and widely used measure of economic activity, it is not without its critics and significant limitations. Understanding these shortcomings is crucial for a nuanced interpretation of what is GDP truly telling us about a country’s welfare and progress. GDP primarily focuses on economic output and market transactions, often overlooking critical aspects that contribute to overall societal well-being.
Exclusion of Non-Market Activities
One of the most significant limitations of GDP is its exclusion of productive activities that occur outside formal markets. This includes:
- **Household Production:** Tasks like cooking, cleaning, childcare, and home maintenance performed by individuals for their own families are productive but not exchanged for money, so they don’t contribute to GDP.
- **Volunteer Work:** Services provided by volunteers to communities or organizations, while creating immense value, are also excluded.
- **The Underground Economy:** Informal or illegal economic activities (e.g., undeclared work, drug trade) are not officially recorded and thus fall outside GDP calculations, even though they represent real economic transactions.
The omission of these activities means that GDP can understate the true productive capacity and welfare generated within an economy, especially in developing countries where informal sectors might be larger.
Does Not Account for Income Inequality and Distribution
A high GDP per capita might suggest a wealthy nation, but it reveals nothing about how that wealth is distributed among its citizens. A country could have a high GDP driven by a small elite, while a significant portion of its population lives in poverty. GDP does not capture:
- **Wealth Concentration:** Whether economic gains are flowing disproportionately to the top.
- **Disparities in Living Standards:** The gap between the richest and poorest segments of society.
Therefore, GDP alone cannot tell us if economic growth is inclusive or if the benefits are widely shared, which is a critical aspect of social well-being.
Environmental Costs and Sustainability
GDP treats all economic activity as positive, regardless of its impact on the environment. For example, industrial pollution cleanup adds to GDP, as does the production of goods that deplete natural resources. It doesn’t subtract the cost of environmental degradation or resource depletion. This means:
- **Resource Depletion:** The consumption of non-renewable resources for production contributes positively to GDP in the short term, but GDP doesn’t reflect the long-term cost to natural capital.
- **Pollution and Climate Change:** Activities that cause pollution or contribute to climate change increase GDP through industrial output, but the subsequent costs of mitigation, health issues, or disaster recovery also further boost GDP, creating a perverse incentive.
This “blind spot” means GDP can offer a misleading picture of sustainable economic progress.
Quality of Life, Health, and Education
While economic prosperity often correlates with better social outcomes, GDP doesn’t directly measure these. It doesn’t quantify:
- **Leisure Time:** A country could have a high GDP because its workforce works excessively long hours, leading to lower quality of life.
- **Health and Education Outcomes:** While spending on healthcare and education contributes to GDP, the effectiveness or quality of these services is not measured. A country might spend a lot on healthcare but have poor health outcomes, yet GDP would only reflect the spending.
- **Happiness and Social Cohesion:** These subjective but vital aspects of human welfare are entirely outside the scope of GDP.
In essence, GDP measures “how much” an economy produces, not “how well” its citizens are living or “how sustainably” it is growing. Critics argue that relying solely on GDP can lead to policies that prioritize economic expansion over environmental protection, social equity, or individual well-being. Therefore, GDP should be viewed as one important indicator among many when assessing a nation’s overall progress and prosperity.
6. How GDP Affects Your Personal Finances, Jobs, and Investments
Understanding what is GDP goes beyond economic theory; it has direct and profound implications for your personal financial health, career prospects, and investment portfolio. The ebb and flow of a nation’s GDP can dictate the availability of jobs, the stability of your income, the interest rates you pay, and the returns you see on your savings and investments.
Impact on the Job Market and Wages
One of the most immediate effects of GDP growth is on employment. A robust, expanding economy (indicated by rising real GDP) generally translates to:
- **Job Creation:** Businesses, anticipating increased demand for their products and services, expand operations, requiring more workers. This leads to lower unemployment rates and more job opportunities across various sectors.
- **Wage Growth:** With higher demand for labor and lower unemployment, workers gain more bargaining power, which can lead to higher wages and improved benefits. This increases household disposable income.
- **Improved Career Prospects:** A growing economy encourages innovation and the development of new industries, opening up new career paths and opportunities for skill development.
Conversely, a contracting GDP (recession) often leads to job losses, stagnant wages, and increased competition for fewer available positions. Understanding GDP trends can help you anticipate shifts in the job market and plan your career moves accordingly.
Influence on Interest Rates and Borrowing Costs
Central banks, like the Federal Reserve in the United States, closely monitor GDP figures when formulating monetary policy. Their primary goals include maintaining price stability and maximizing employment. GDP growth plays a critical role in their decisions:
- **Rising GDP (Economic Expansion):** Strong economic growth can lead to inflationary pressures as demand outstrips supply. To cool down the economy and prevent runaway inflation, central banks might raise benchmark interest rates. This, in turn, increases the cost of borrowing for mortgages, car loans, credit cards, and business loans.
- **Falling GDP (Economic Contraction/Recession):** During periods of economic slowdown, central banks may lower interest rates to stimulate borrowing and spending, encouraging economic activity. This makes loans cheaper for consumers and businesses, potentially boosting investment and consumption.
For your personal finances, these interest rate shifts directly affect the cost of your debts and the returns on your savings accounts or fixed-income investments. A period of sustained GDP growth and higher rates could mean paying more on your variable-rate mortgage but earning more on your savings.
Effect on Investments and Portfolio Performance
GDP figures are a cornerstone of investment analysis. Investors and financial analysts use GDP data to gauge the overall health of the economy, which influences corporate earnings, stock market performance, and the attractiveness of different asset classes.
- **Stock Market:** Generally, strong real GDP growth is positive for the stock market. Economic expansion leads to higher corporate revenues and profits, which can drive up stock prices. Conversely, a slowdown in GDP growth can signal reduced corporate earnings and lead to stock market corrections or bear markets.
- **Bonds:** The relationship here is more complex. During periods of strong GDP growth, if inflation concerns arise, central banks might raise interest rates, which typically causes bond prices to fall (as new bonds offer higher yields). However, during recessions or periods of weak GDP, when interest rates are cut, bond prices can rise.
- **Real Estate:** A healthy GDP often supports a strong housing market, as job growth and higher wages increase demand for housing. Conversely, a weak GDP can lead to slower housing price appreciation or even declines.
By keeping an eye on GDP reports and projections from reputable sources like the IMF, World Bank, and national statistical agencies, you can make more informed decisions about your investment strategy, potentially adjusting your portfolio to align with economic cycles. It helps you understand the broader economic context in which your individual financial decisions are made. For a comprehensive look at market trends, consider subscribing to diaalnews’ market analysis newsletter.
7. Global GDP Comparisons and Their Significance in the World Economy
Understanding what is GDP takes on an even broader meaning when viewed in a global context. Comparing GDP across countries provides crucial insights into the relative economic size, influence, and living standards of nations. These comparisons are vital for international trade, foreign investment, geopolitical analysis, and for understanding global economic trends. However, direct comparisons of nominal GDP can sometimes be misleading, necessitating other metrics.
Comparing Economic Size: Nominal GDP Rankings
When countries are ranked by their nominal GDP, we get a snapshot of their absolute economic output at current market prices. This ranking is often used to assess a nation’s economic power and its contribution to the global economy. For example, countries like the United States, China, Germany, and Japan consistently feature among the largest economies by nominal GDP. Such rankings are important for:
- **Geopolitical Influence:** Larger economies often wield greater influence in international organizations and trade negotiations.
- **Market Size:** A large nominal GDP suggests a substantial domestic market for goods and services, attractive to multinational corporations.
- **Global Trade Share:** Nations with higher GDPs typically account for a larger share of global trade and investment flows.
However, comparing nominal GDPs in different currencies requires conversion rates, which can fluctuate significantly, affecting the perceived size of an economy. Moreover, nominal GDP does not account for differences in population size or the cost of living.
GDP Per Capita: A Glimpse into Living Standards
To get a better sense of the average standard of living within a country, economists often look at GDP per capita, which is calculated by dividing a country’s total GDP by its population. This metric provides a rough indicator of how much economic output is produced, on average, for each person. Countries with high GDP per capita (e.g., Luxembourg, Switzerland, Ireland, Norway) are generally considered wealthy, with higher levels of income and access to goods and services for their citizens.
- Indicator of Prosperity: A higher GDP per capita often correlates with better public services, infrastructure, health outcomes, and educational opportunities.
- Development Metric: It’s a key measure used by organizations like the World Bank to classify countries into different income groups (low-income, middle-income, high-income).
However, even GDP per capita has limitations, as it’s an average and does not reflect income distribution or inequality within a nation.
Purchasing Power Parity (PPP): Adjusting for Cost of Living
For more accurate comparisons of living standards and economic output between countries, economists often use GDP adjusted for Purchasing Power Parity (PPP). PPP rates account for differences in the cost of living and inflation rates between countries, allowing for a more ‘apples-to-apples’ comparison of economic output.
PPP considers that a dollar, when converted to local currency, might buy significantly more in one country than in another. For instance, while China’s nominal GDP is lower than the U.S., its GDP (PPP) is often larger, reflecting that the cost of living and producing goods and services is generally lower in China.
PPP adjustments are critical for:
- **True Economic Size:** Providing a more realistic comparison of the underlying volume of goods and services produced.
- **Living Standards:** Offering a better gauge of the actual purchasing power and welfare of citizens across different nations.
- **International Aid and Development:** Informing decisions on aid allocations and development programs by reflecting real economic needs and capacities.
The Global Economic Landscape in 2026 (Hypothetical)
As of 2026, global GDP figures continue to show dynamic shifts. Major economies are navigating challenges such as technological disruption, climate change, and evolving trade relationships. The International Monetary Fund (IMF) and the World Bank regularly publish detailed reports and forecasts on global GDP, providing critical data for analysts and policymakers. These reports highlight trends in regional growth, emerging market performance, and the economic impact of global events. For example, forecasts might show continued robust growth in certain Asian economies, moderate expansion in North America, and varied performance across European nations, influenced by domestic policies and external factors like commodity prices and global supply chain stability.
Explore the latest global economic trends and forecasts.
Comparison Table: Leading Economies by GDP (Hypothetical 2026 Estimates)
To illustrate the scale of global economies, here’s a simplified comparison of hypothetical GDP figures for leading nations in 2026, alongside their GDP per capita and PPP adjustments. These figures are illustrative and reflect how different metrics can present varied perspectives on national economic strength and individual prosperity. This table highlights how countries can rank differently based on the metric used, underscoring the importance of considering both overall economic output and per-person wealth adjusted for purchasing power.